RedM / FiveM documentation
Murphy’s Platform
Monitoring and insights
Analytics
Measure player, revenue, ticket, and whitelist performance over time.
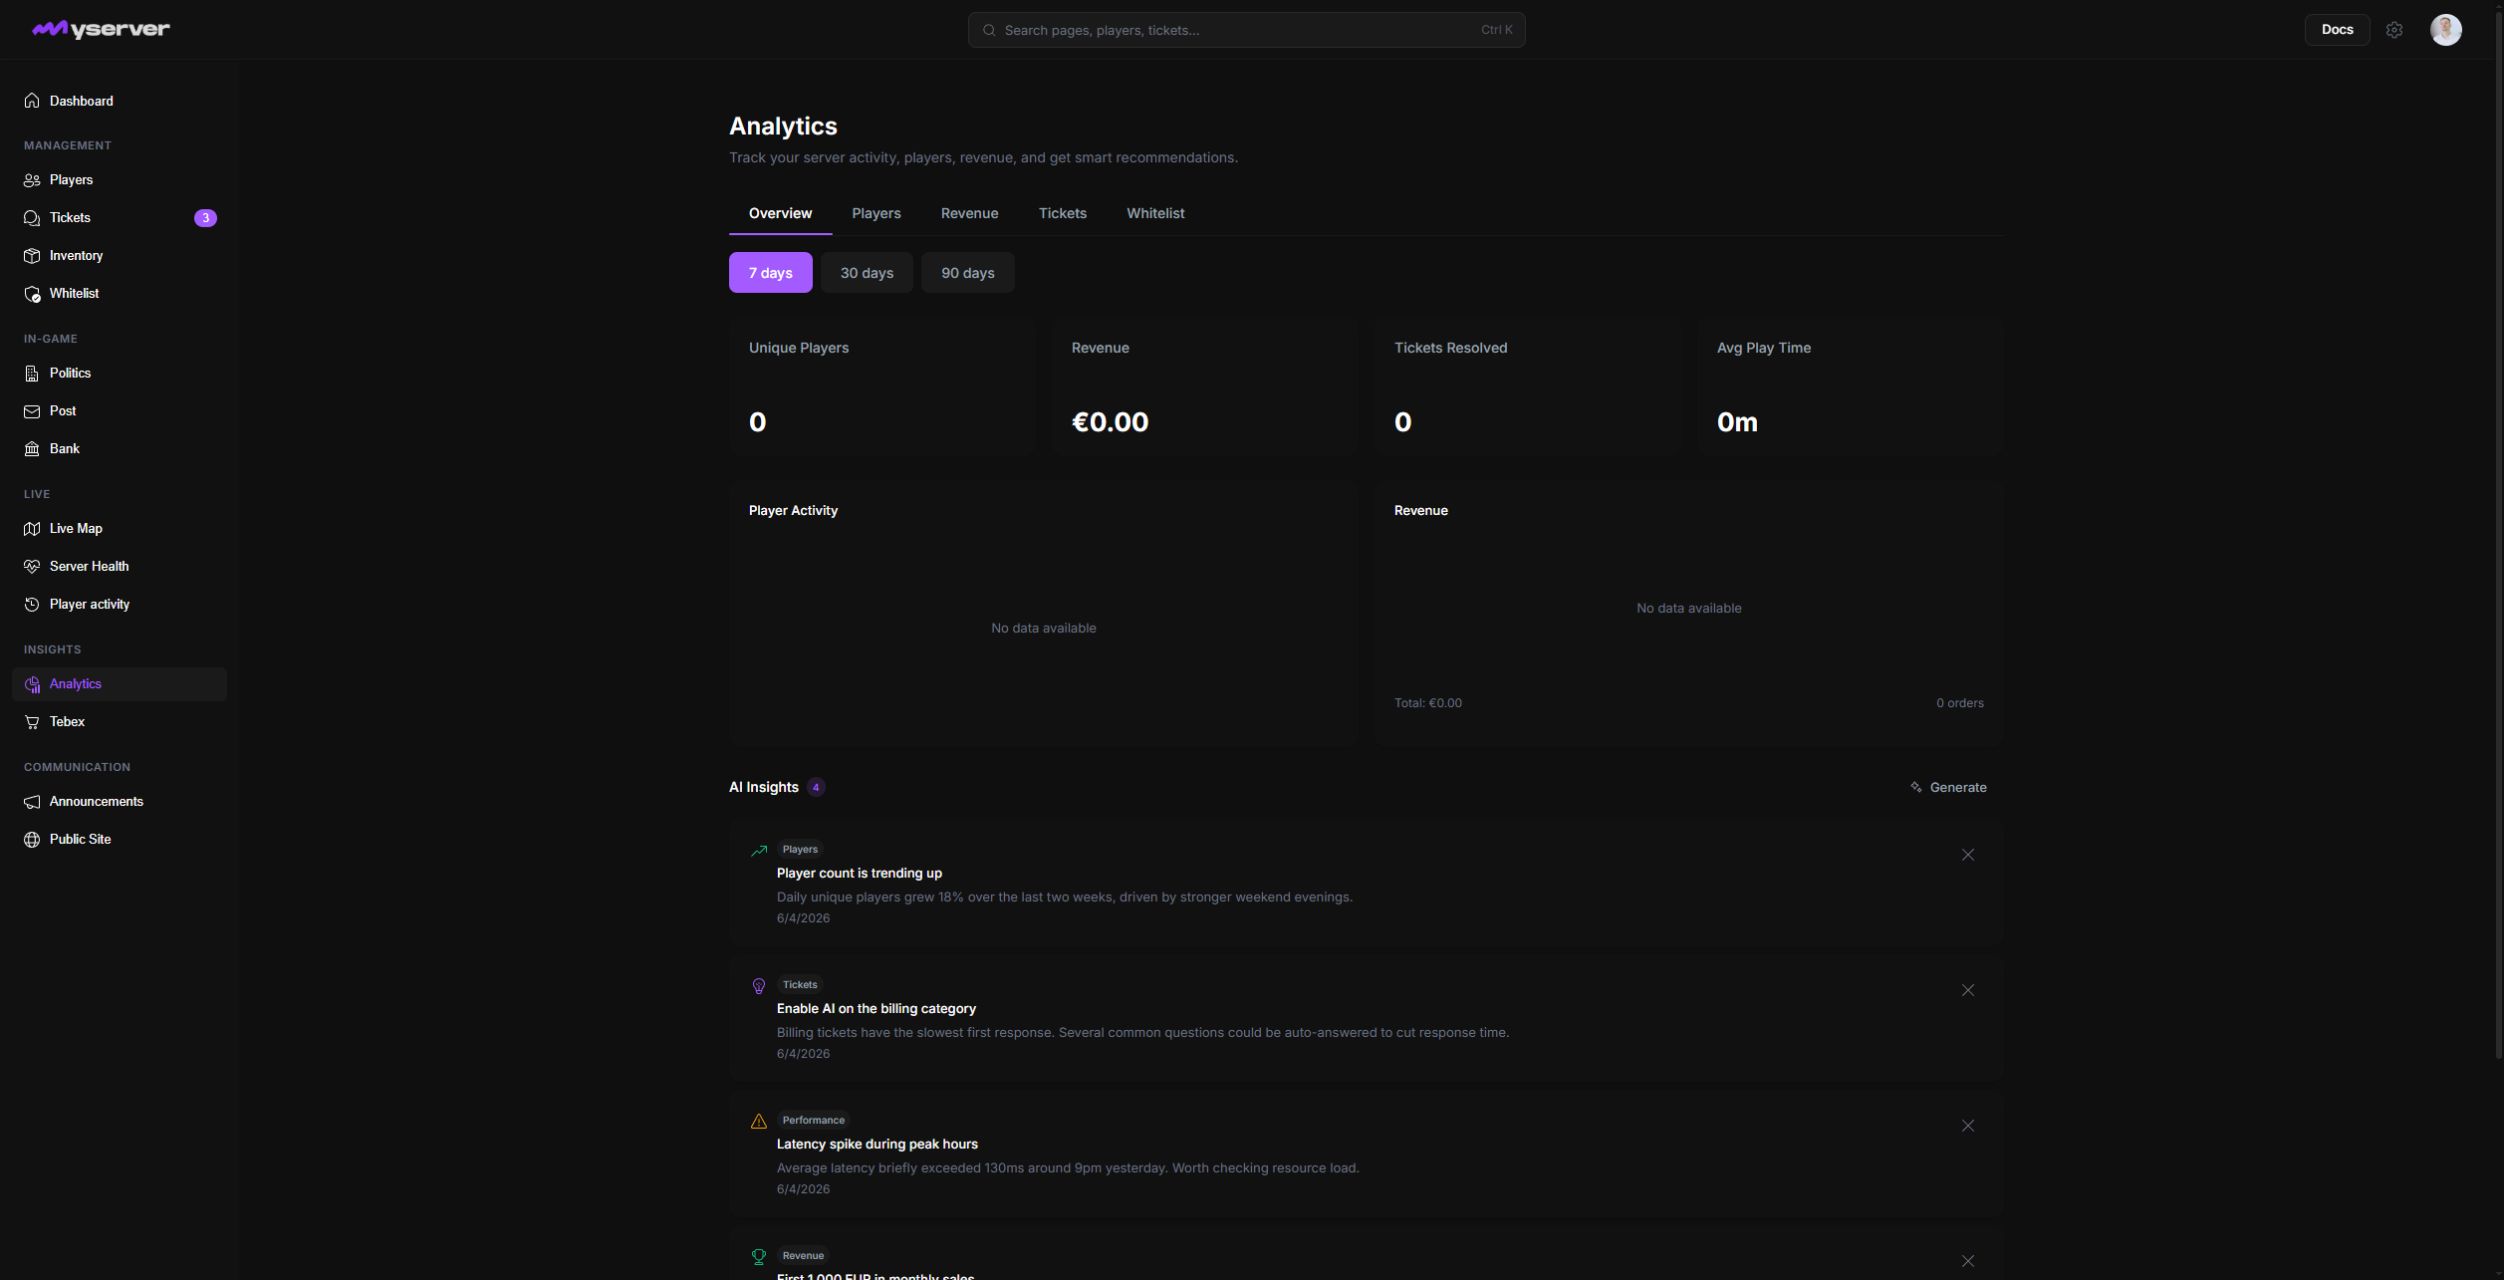
Analytics turns synchronized events into trends for the selected date range.
Build a comparable view
- Overview summarizes the most important cross-workspace metrics.
- Players covers active users, new players, retention, churn, and peak times.
- Revenue summarizes Tebex purchase and value trends when connected.
- Tickets reports volume, response, resolution, AI handling, and satisfaction.
- Whitelist reports applications, review flow, interviews, approvals, and rejections.
Use 7, 30, or 90 days according to plan access and the question you are answering. Compare the same period and filters when checking whether a change improved the result.
No data can mean there was no activity, the integration was not configured, the selected period predates data collection, or the relevant sync is failing.
Confirm the source page before treating an empty chart as a real zero. For example, check the ticket queue before concluding that ticket volume is zero.
Use metrics for decisions
Analytics is most useful when tied to an action: staff peak hours, improve whitelist review time, investigate churn, validate a store campaign, or track support quality.
Last updated: September 11, 2026