RedM / FiveM documentation
Murphy’s Platform
Daily operations
Dashboard
Read the current server state and move directly to the queues that need attention.
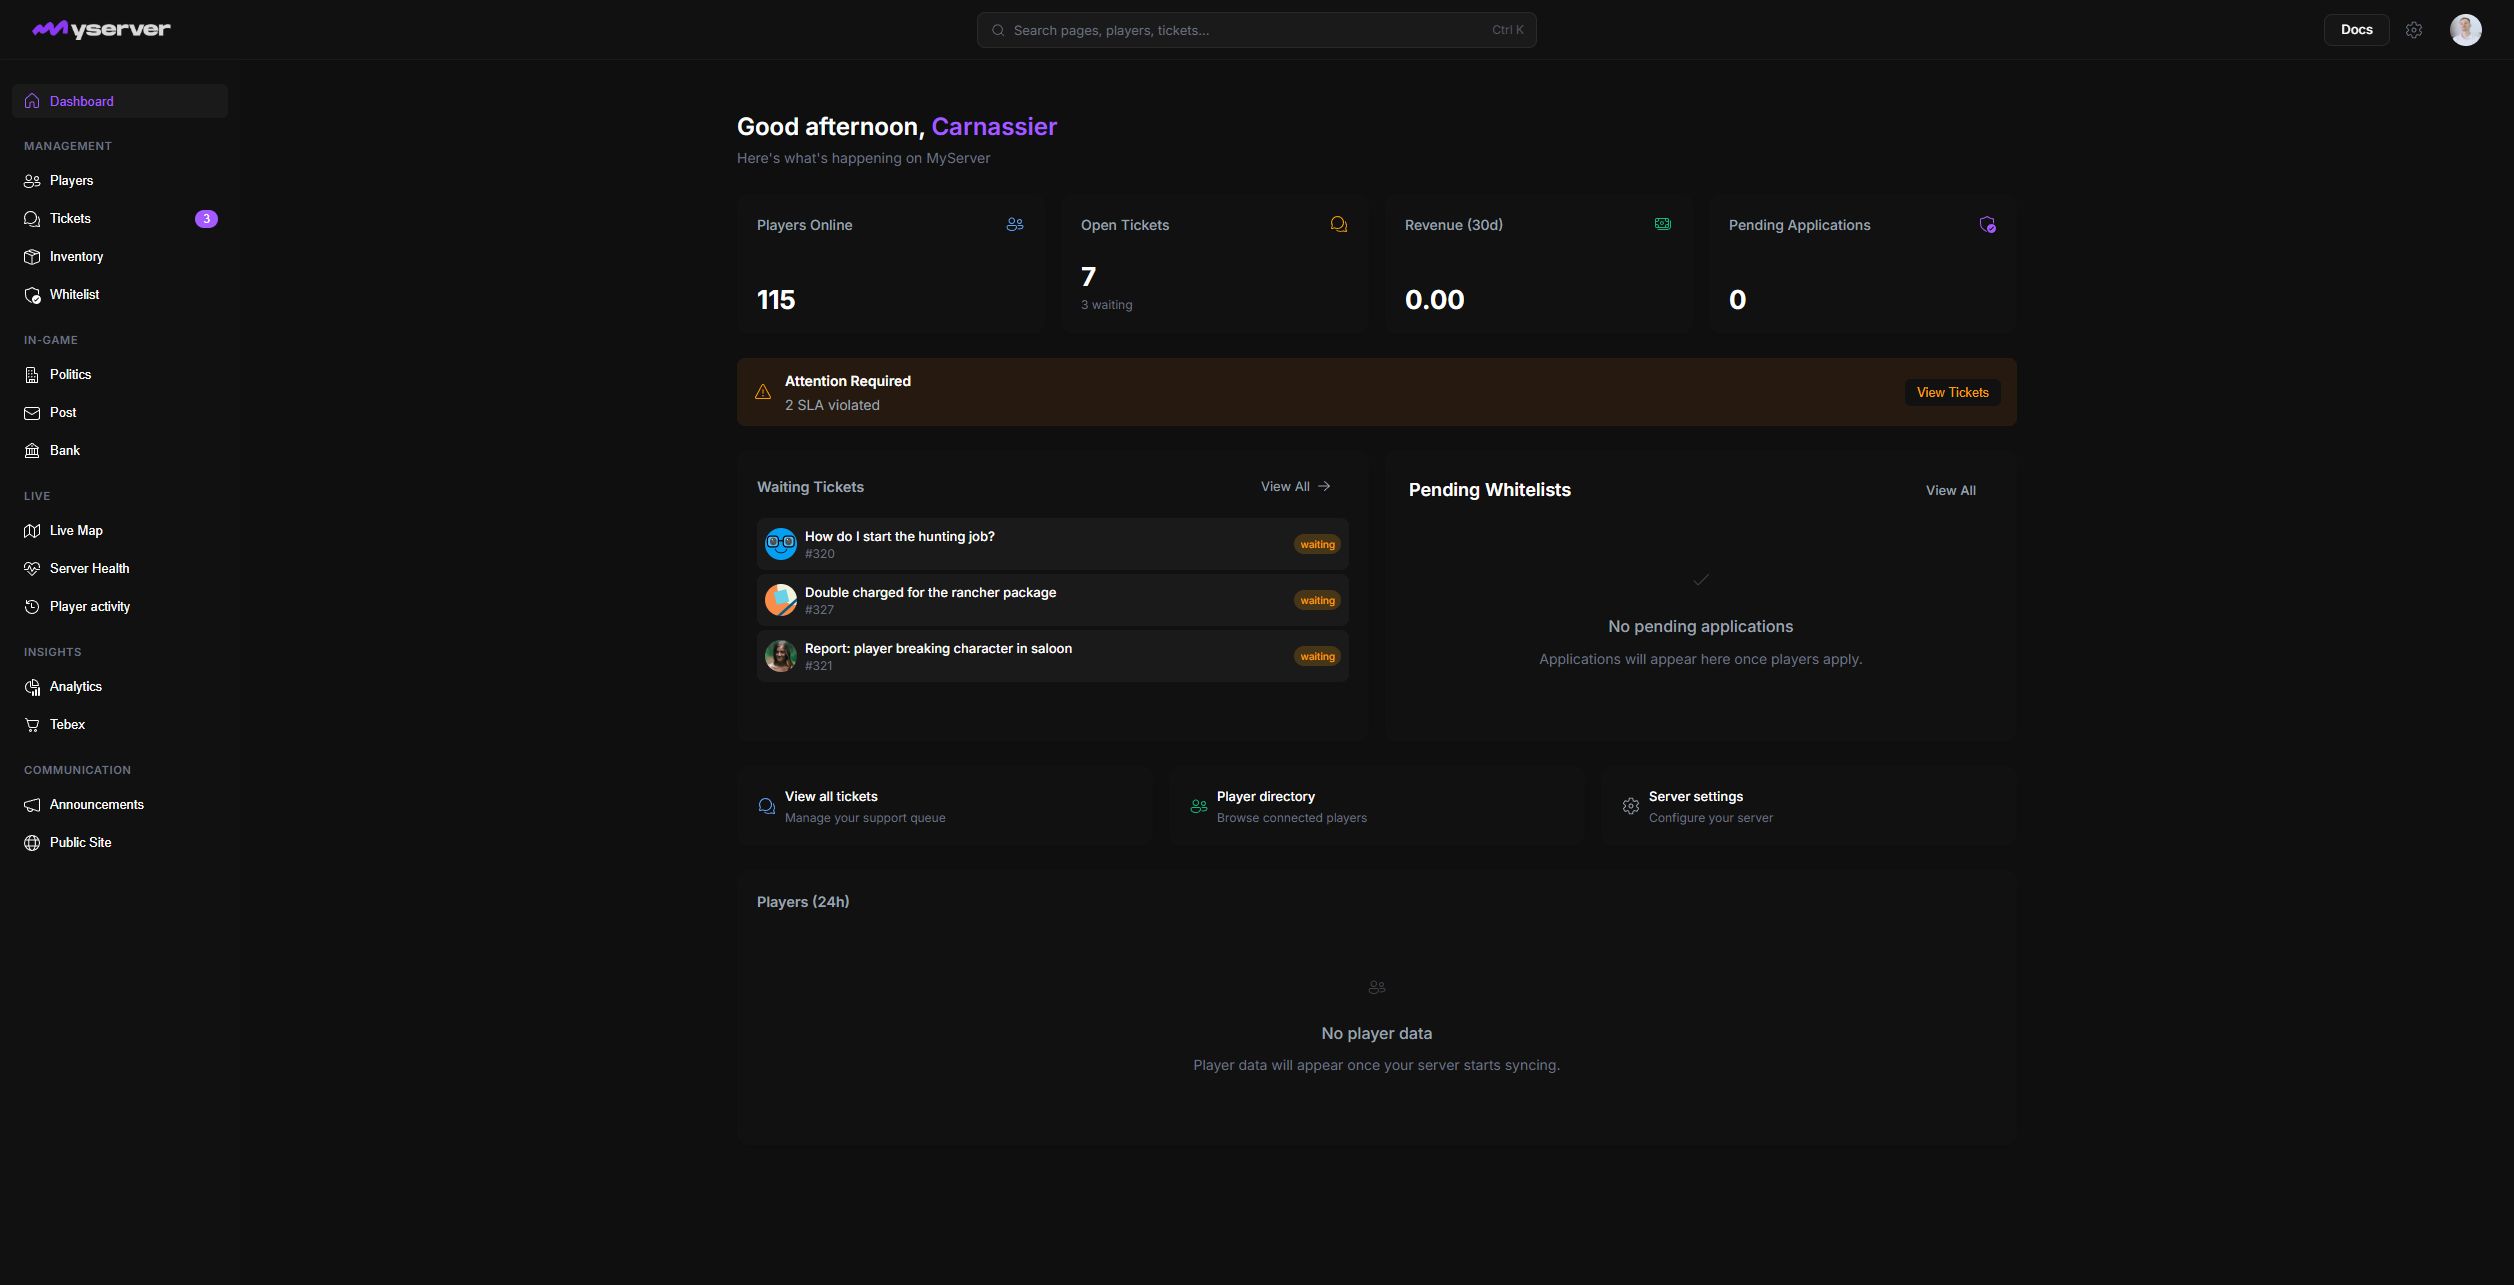
The Dashboard is the operational summary for the selected server. Use it to decide what needs attention, then open the detailed page for the actual work.
Read the dashboard as an action list
The first row summarizes the current workload:
- Players Online is the latest connected player count.
- Open Tickets includes unresolved support work and highlights waiting tickets.
- Revenue reflects the configured Tebex reporting period.
- Pending Applications counts whitelist work waiting for review.
The values depend on the connected resource and integrations. A zero can mean there is no activity, or that the related integration has not been configured yet.
The attention area highlights operational issues such as breached ticket SLAs. Use the provided action to open the relevant queue.
Waiting tickets and pending whitelist applications are displayed as focused lists. Open an item to continue the workflow without searching again.
Dashboard shortcuts lead to the ticket queue, player directory, and server settings. They are navigation aids, not a separate configuration surface.
When the dashboard is empty
If every server metric is empty, check Server Connection first. If players are present but commerce or applications are empty, verify the related Tebex, Discord, or whitelist configuration instead.
Last updated: September 11, 2026